Transparency for Software Climate Impact
Concepts Towards a Life Cycle Assessment of Software
The information and communication technology (ICT) sector is estimated to currently contribute to ~1.5–4% of global greenhouse gas (GHG) emissions (Bieser et al., 2023). Accordingly, the energy efficiency of hardware, for example in data centres, has already been well studied (Schödwell et al., 2018; Hintemann and Hinterholzer, 2022). Software, on the other hand, as an immaterial good, actually has no direct energy consumption (Hilty, 2019).
///<quote>
The software determines
how and for what kind
of computations the hardware
is used and influences
the energy
///</quote>
It is the hardware that consumes the electricity in the ICT area and the software that utilises this hardware. The software determines how and for what kind of computations the hardware is used and influences the energy consumption of the hardware for a certain task. [Figure 1] shows an example from Gröger et al. (2018) with different resources and therefore different energy consumptions for various software products performing the same task. In our approach, we are guided by the methodology of life cycle assessments (LCA) and view software as the main target for the energy used by the hardware itself but also for the environmental impacts generated from manufacturing the hardware. The environmental impacts of energy consumption stem from the way energy is currently produced, which generally entails large CO2 emissions (bp, 2021). Furthermore, the manufacturing of hardware causes CO2 emissions through mineral mining, plastics and metals production, and the factories required to execute the related processes (Boavizta, 2023).
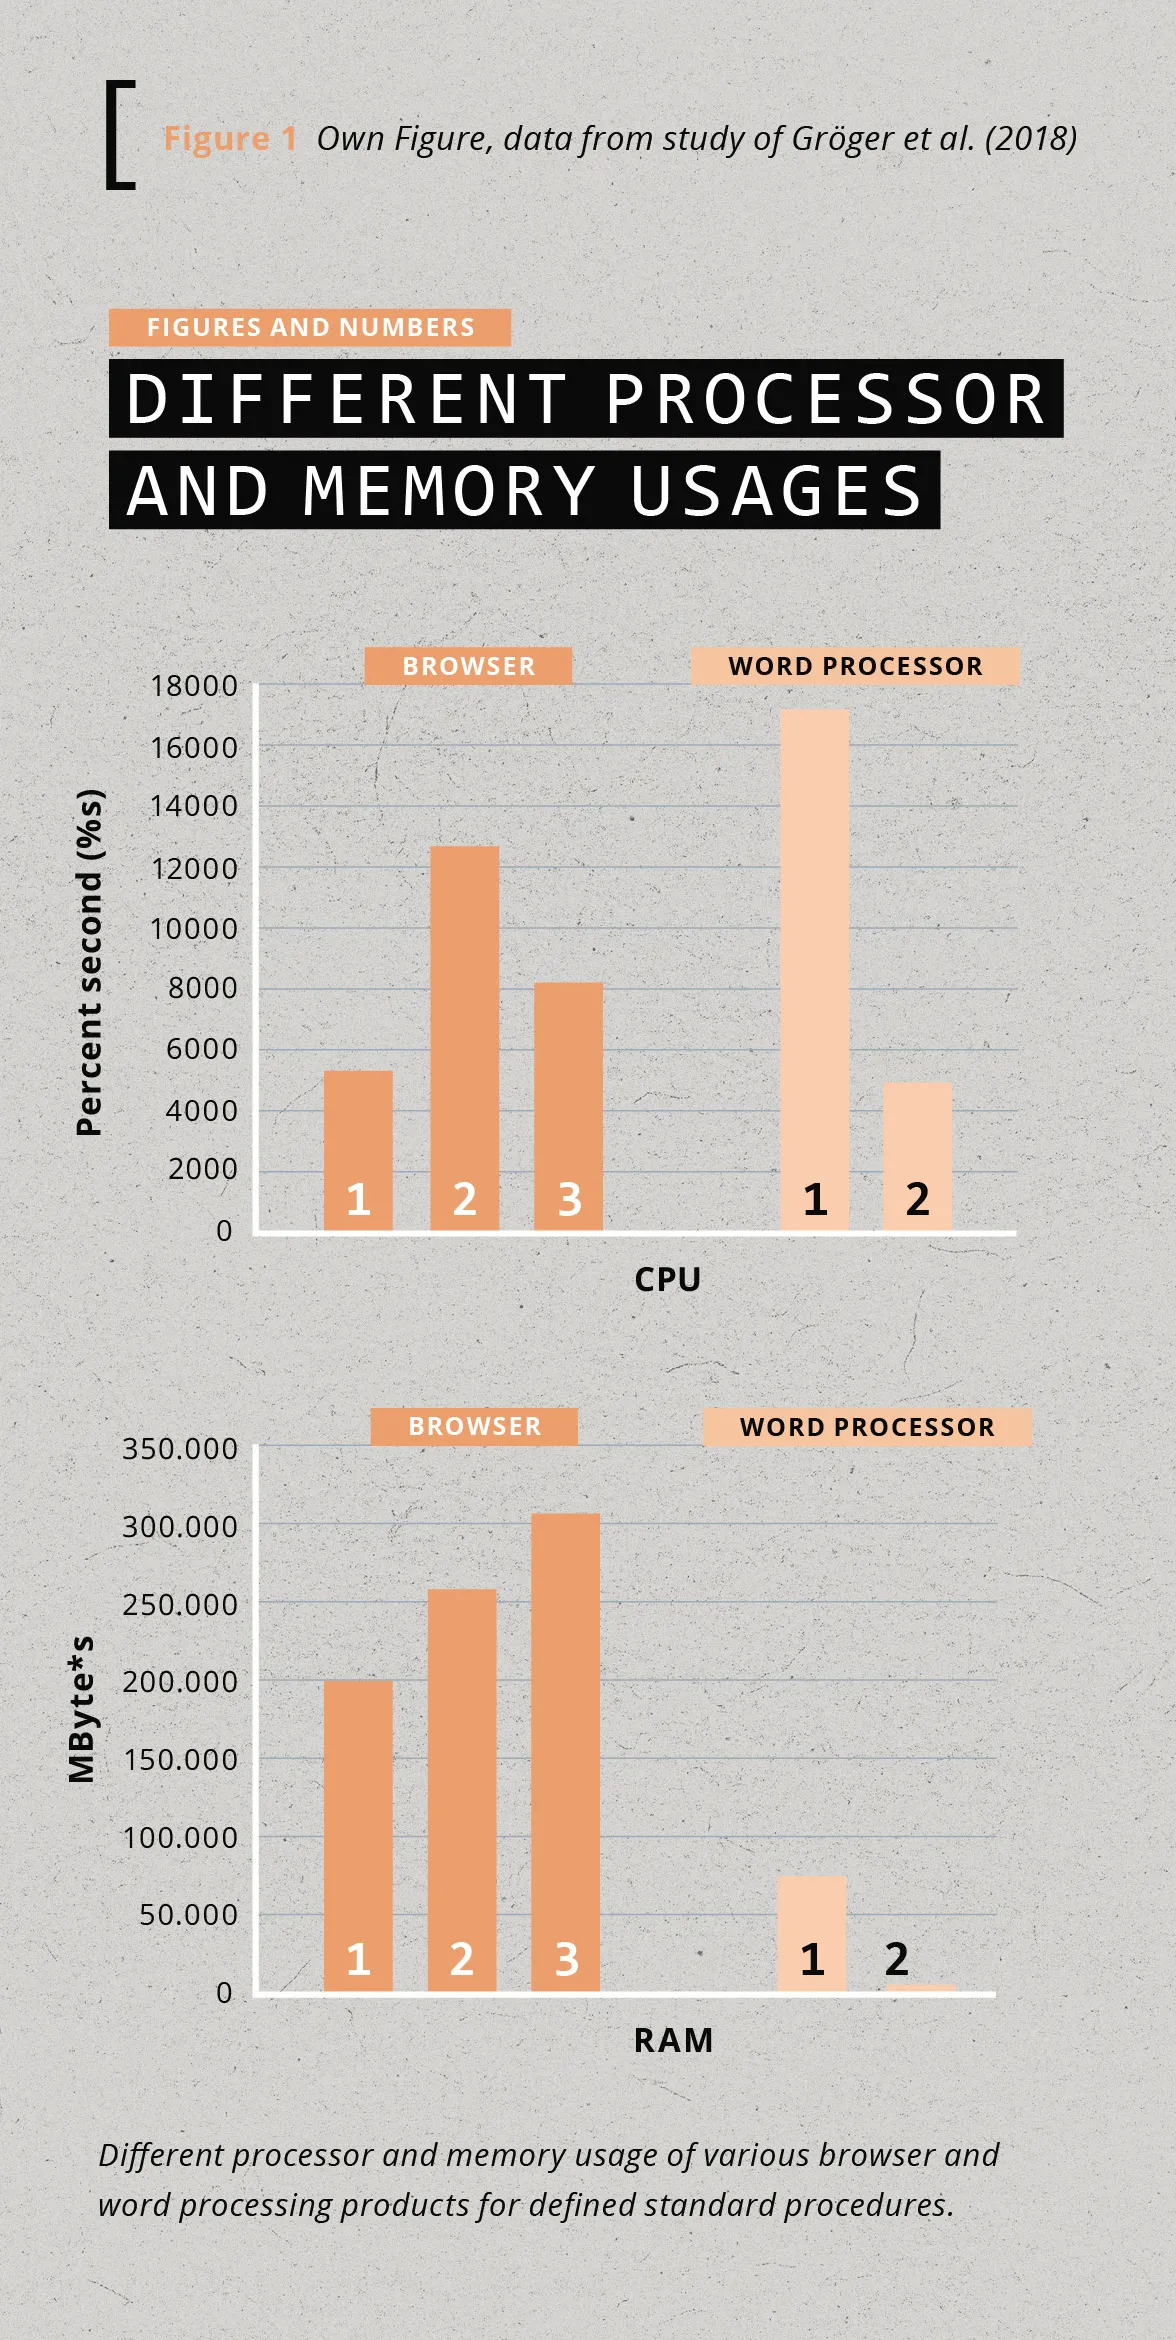
Another factor influencing energy con- [ Figure 1 Own Figure, data from study of Gröger et al. (2018) sumption is the ‹software bloat› effect, in which software products continue to grow. However, the additional functionality they acquire entail using increasing resources since more processor performance, memory, and hard disk space are required. Software thus becomes more unspecific over time. But beyond the overhead from additional functionality, some more resource consumption also comes from a relatively unspecific growth of the code over time, for example, from adding additional software packages or from increasing abstraction. This growth in overhead is almost natural as the number of developers increases the longer the software is in use and, in many cases, developers bring their own preferences in libraries and frameworks. To be able to manage the environmental impact of the digital sector in a targeted manner, we split the resource consumption of software into ‹digital resource primitives›. These primitives make it possible to map software in the different phases of its life-cycle (Manufacturing/Development, Distribution, Usage, Disposal/Removal) to its environmental impact. A LCA requires solutions to perform an inventory analysis of resource usage and environmental impacts. We show how to perform this analysis in our ‹double conversion model› using digital resource primitives in a detailed example for the software usage phase. In this article, we consider only the usage phase of software and focus on determining the embedded environmental impacts and resource use of ICT equipment as well as the primary energy use. The described process and model can easily be extended to the other life-cycle phases.
Conducting an integrated lca
Digital Resource Primitives (DRPs) are defined as the low-level digital resources required to operate digital products and services. They can be seen as the fuel that powers software applications [Figure 2]. They allow a direct mapping onto a physical hardware resource.
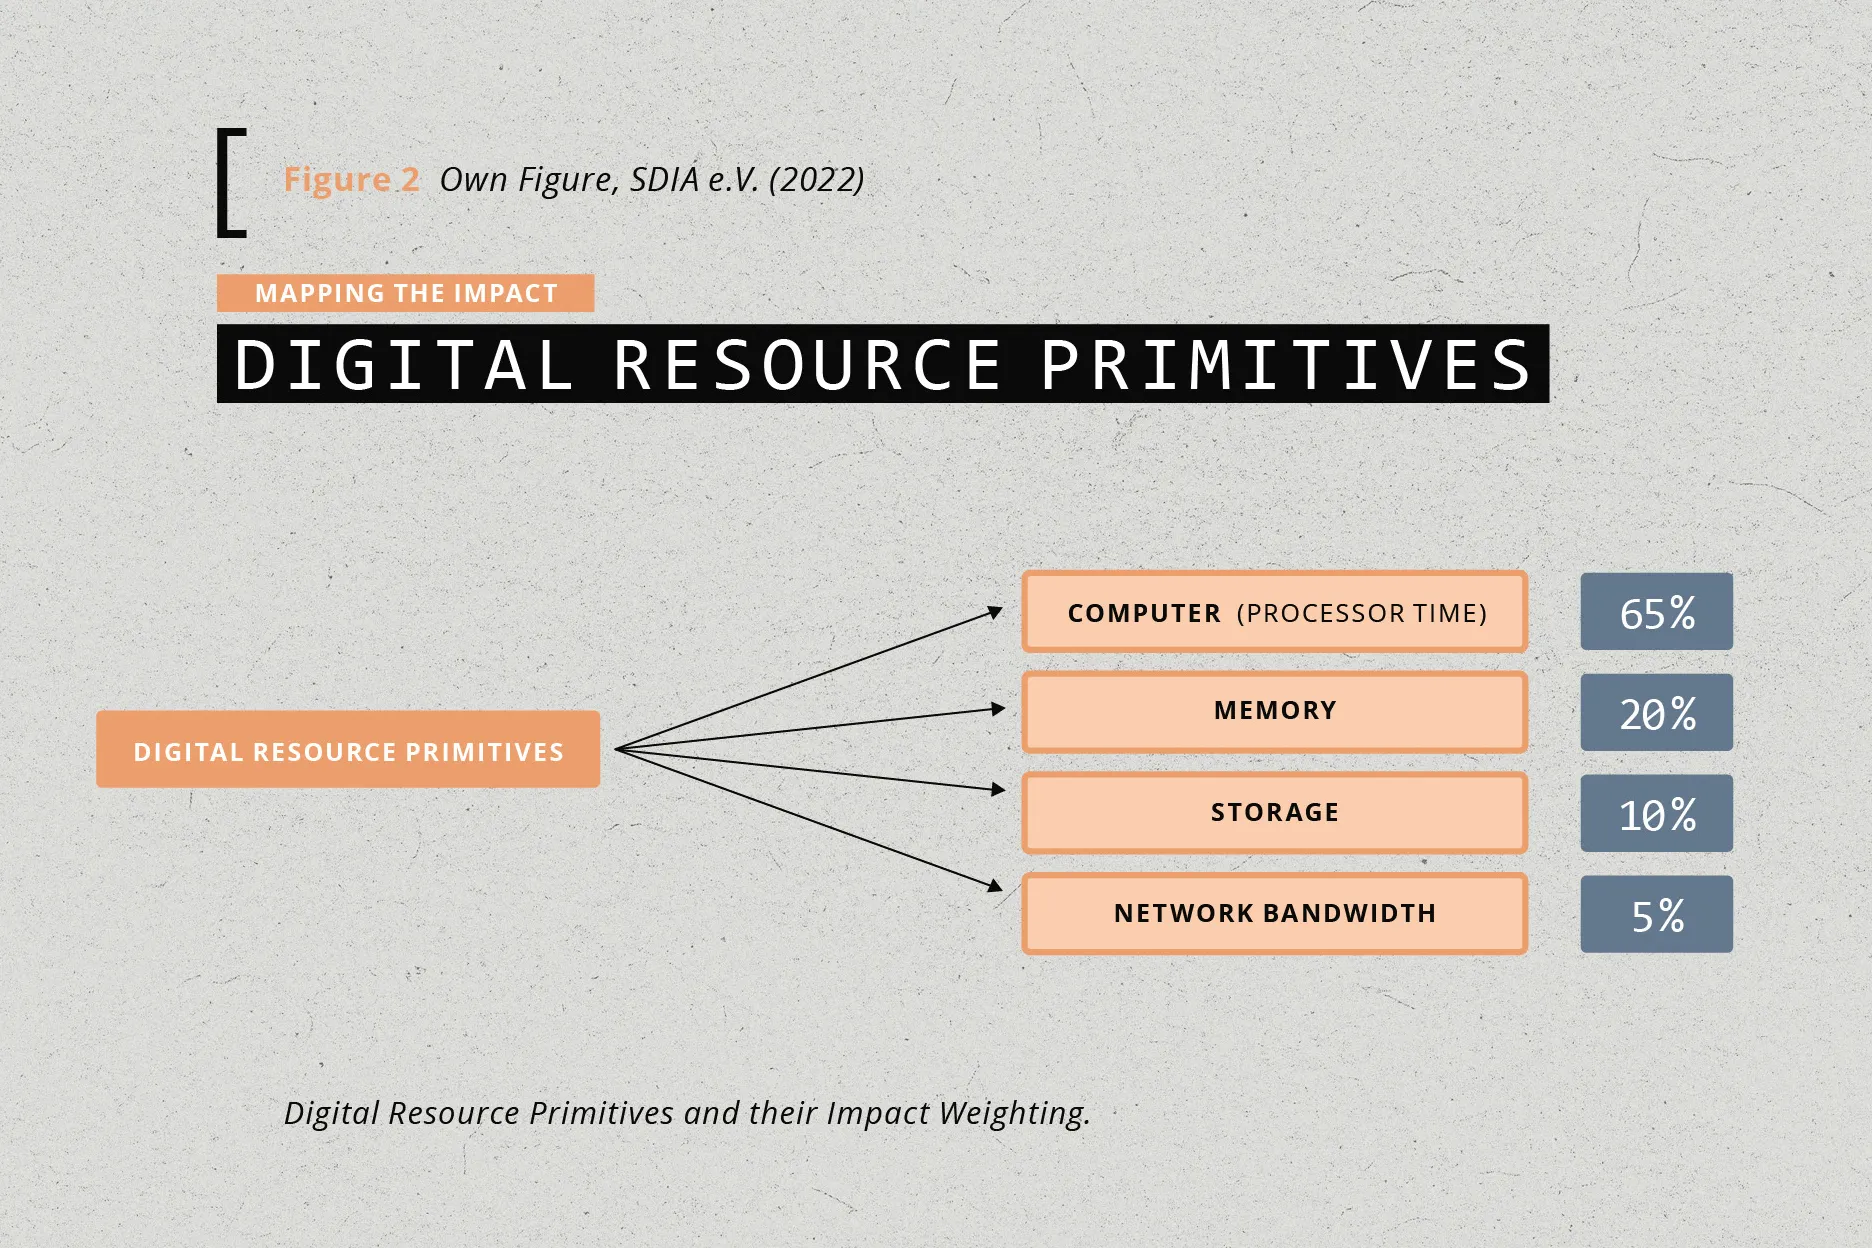
A central processing unit (CPU) is a digital resource that a software can consume. CPU utilisation has the most significant correlation to power consumption, e.g., a utilisation of 80% is responsible for a similar percentage of energy use.
///<quote>
CPU utilisation
has the most significant
correlation
to power consumption.
///</quote>
The other digital resources are memory capacity, storage capacity, and network capacity. Through these units, we can assign the environmental impact of the value chain of the physical equipment (server, cables, rack, data centre equipment, building) that is converting energy into digital resources to each unit (e.g., 1 kg CO2-eq from producing a server for 1 GB of memory capacity).
An example
A generic server might have a ‹digital resource production› capacity of 48 CPU cores (producing CPU cycles per second), 100 Gbit of network capacity, 128 GB of memory capacity, and 2 TB of storage capacity. For this server to operate and be able to produce these resources, the environmental impact from manufacturing, transporting, operating and disposing of the server should be attributed to each digital resource unit the server produces, for example,
- Cabling
- Silicon production of chips
- Power supply, network chips, and cards (for internet connectivity)
- Cooling systems, such as fans and conductive metals (to transport the generated heat away)
- The environmental impact of the energy used when the server was manufactured. The total environmental impact of the server is then attributed to each digital
resource the server produces using a time-share model, whereby the maximum digital resource output is determined over the expected lifetime of the hardware. The only exception is the primary energy consumption, which is determined based on the actual digital resource utilisation of the software (e.g., software may occupy 30% of all the digital resources of one server over its lifetime). As an example: If we know the environmental impact of manufacturing 1 GB of memory that we plan to use for 4 years, and the environmental impact of the electricity for a use/hour, and we have a software application that is using 500 MB (50%) of memory over a period of an hour, we can attribute 50% of the environmental impact of the energy consumption and 50%* (1 hour / 4 years) of the impact of the production of that 1 GB of memory to the application. This double conversion from equipment to digital resources and from digital resources to software is necessary as software itself only consumes digital resources, not physical resources as would be required to perform a Life Cycle Inventory – CPU cycles, memory capacity, storage capacity, and network capacity. We are proposing to perform a LCA of ICT equipment first and then loading the entire environmental impact (spread over the lifetime of the equipment) onto the energy-to-digital-resource conversion machine. Using conversion and by observing the digital resource usage of software, we can determine the environmental impact pro-rata. When doing the pro-rata assignment, however, it must be kept in mind that different DRPs are responsible for different ratios of the energy use. For example, a CPU is responsible for the majority of the power consumption, whereas an SSD storage disk might cause a bigger impact through its manufacturing. As a rule of thumb, we have defined baseline ratios that have been developed using data from other research as described in SDIA (2022) [Figure 2]. However, modern approaches allow a real measurement of many of these DRPs and a far more precise and fair attribution. We discuss these developments in the following section and, while only demonstrating the usage phase, describe how the same method can be re-used in all other LCA phases.
Technical implementation
To provide the needed data to perform a LCA, a measurement setup must be installed that can reliably capture the metrics needed to assess DRP consumption to the required granularity level. The electricity consumption and the exclusive usage time for every relevant software component (database, webserver, caching-layer, browser, etc.) as well as for every hardware component (CPU, RAM, HDD, GPU, etc.) must be determined. Since modern software is typically designed in a microservice architecture, the existing segmentation can be used, which in turn benefits from the reusability of the infrastructure as code that is already available. The typical technology here is the containerisation in form of the industry standard, a ‹Docker (compatible) container›. Many client-side applications today rely on server-side infrastructure to function, hence we use the server side as our main reference point for this article. To construct the final application, our measurement tool needs to be able to set-up both the containers and their network connections. The Docker technology uses concepts from the Linux kernel that allow already existing performance metric endpoints to be captured for all hardware components. These metrics are aggregated separately for every container, which we deem as the needed maximum granularity for our LCA. The use of a software is typically well defined and is already present as either a unit test or an end-to-end test and can thus also be reused or, as Gröger et al. (2018)
///<quote>
To generate
reliable measurements,
a special prepared system
is needed.
///</quote>
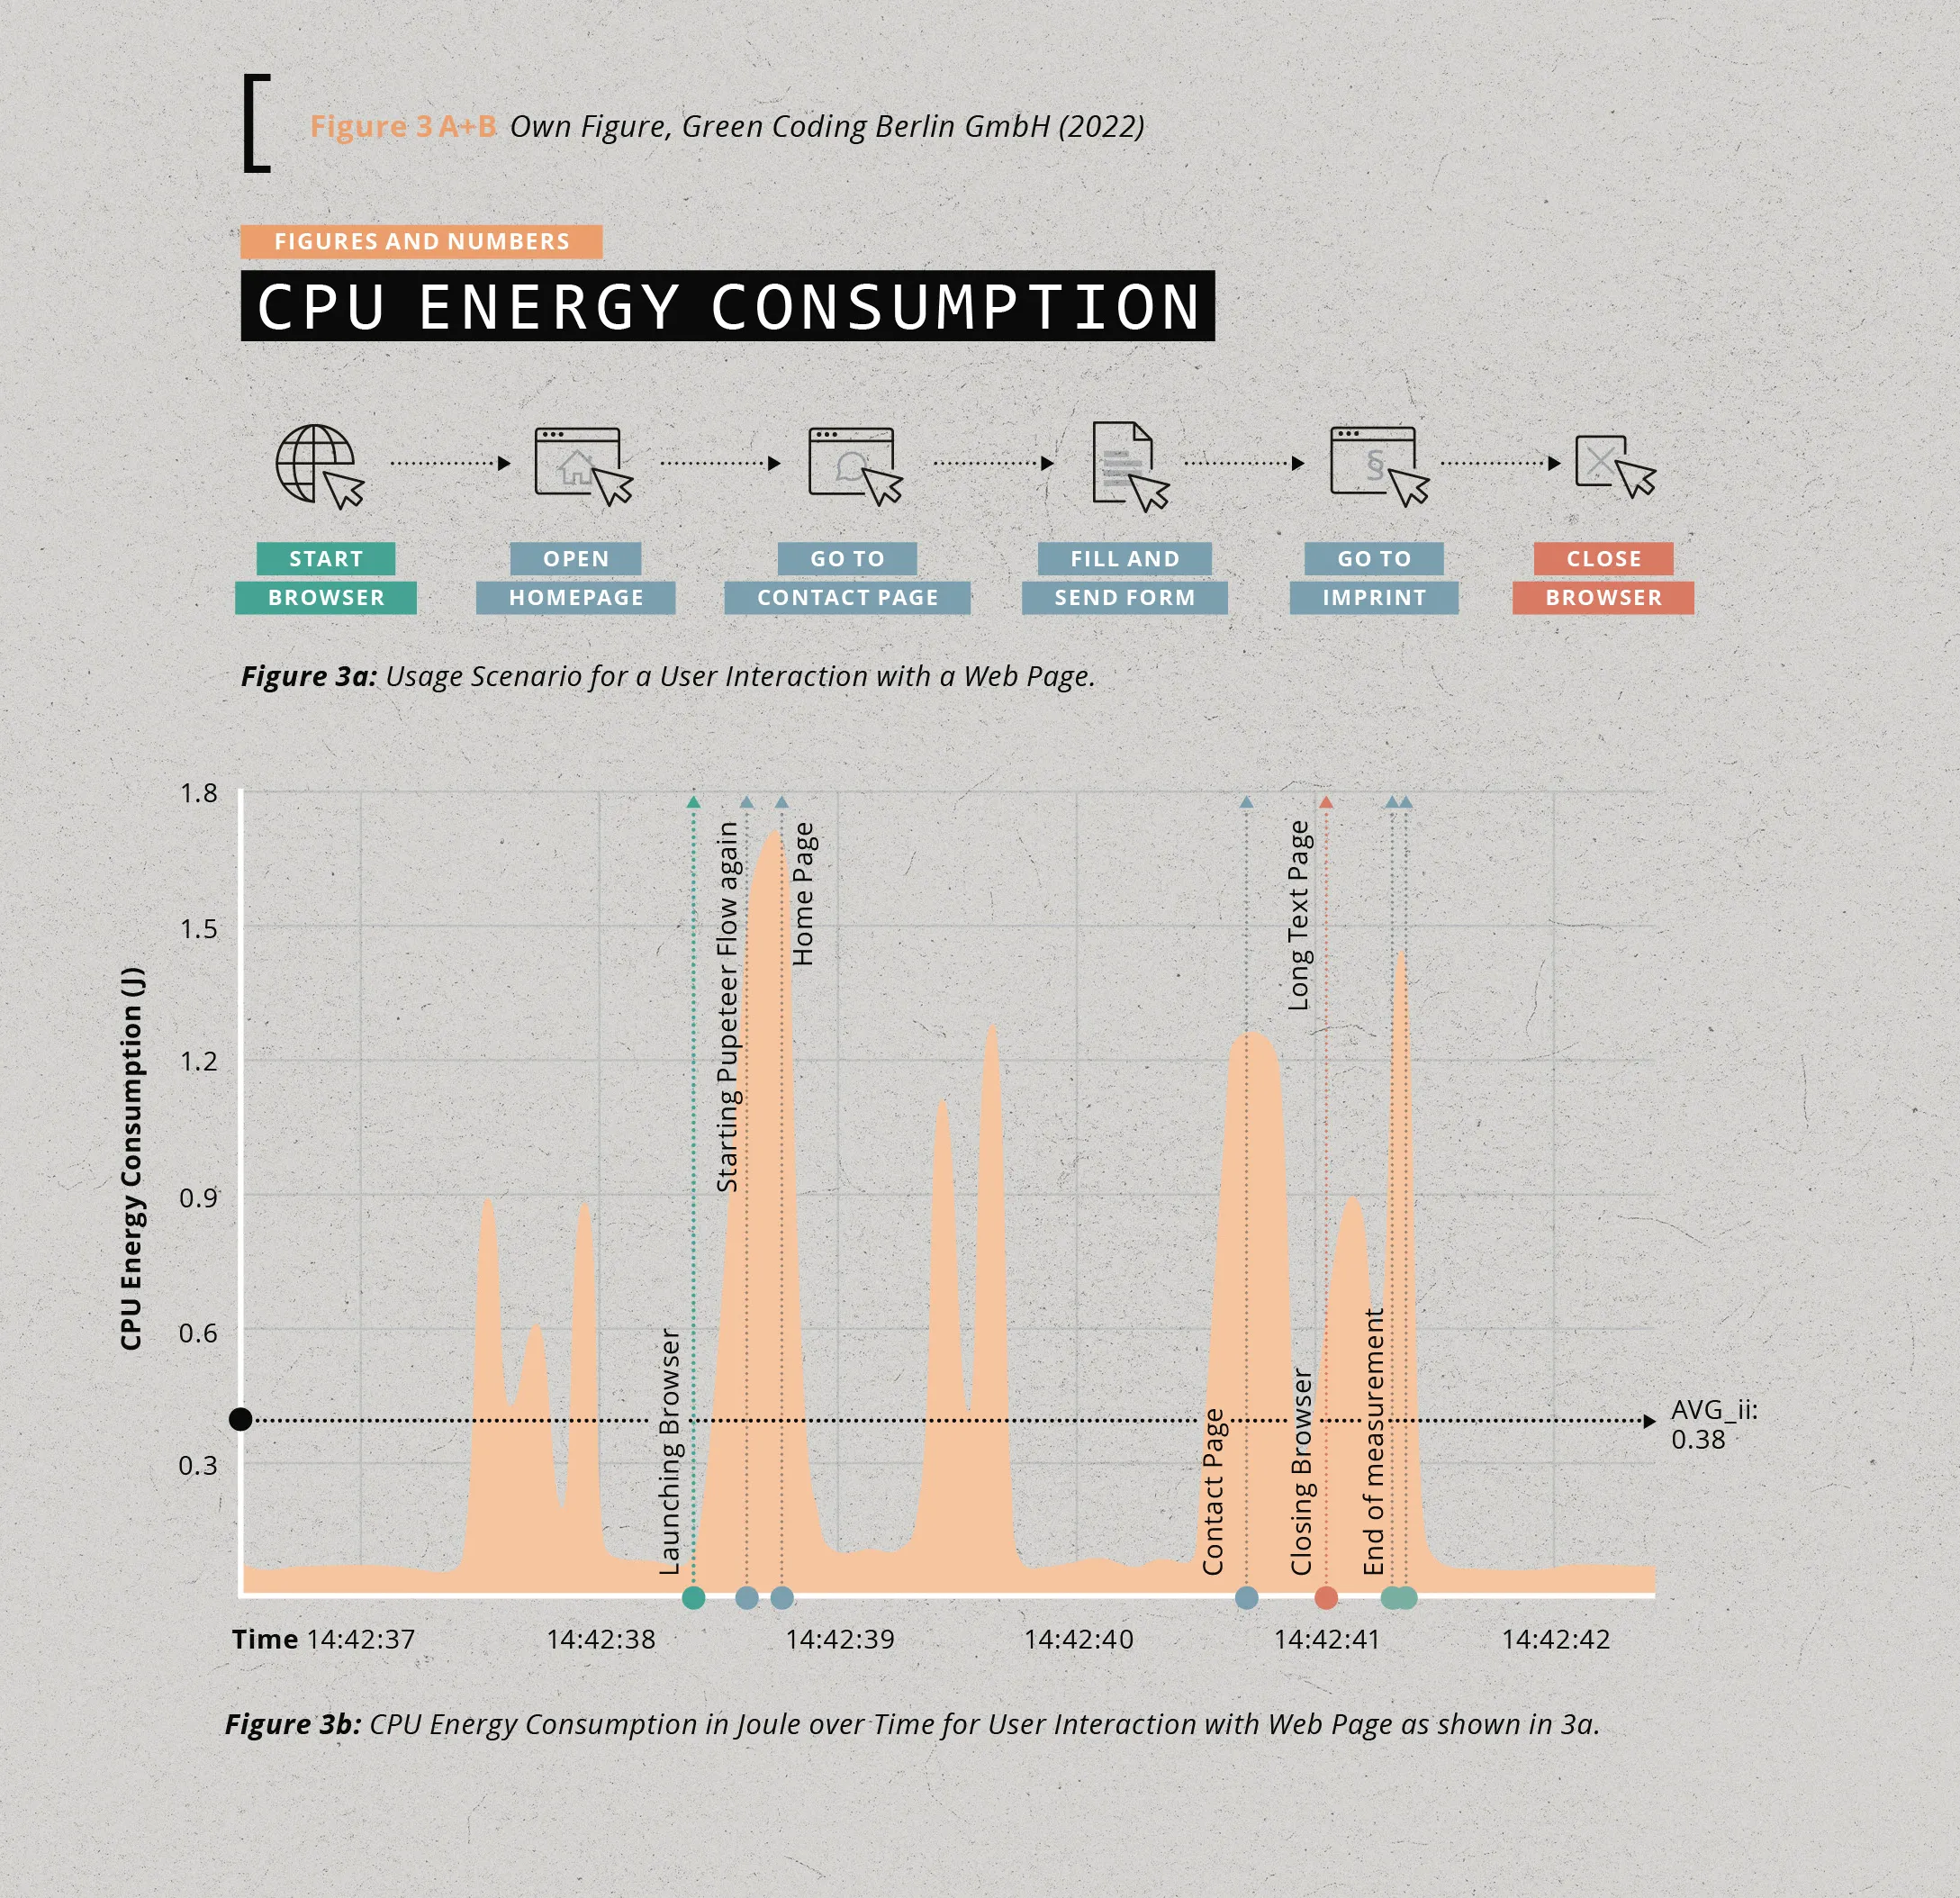
have shown, easily constructed for arbitrary software. [Figure 3a] shows an example of a possible usage pattern for a PDF reader that we could leverage to measure its typical resource consumption. [Figure 3b] shows the corresponding measurement of the energy consumption of the CPU over time when this usage pattern is executed.
To generate reliable measurements, a special prepared system is needed that does not generate any noise during the measurement. We use a standard Ubuntu operating system and turn off every functionality that typically caters for automatic updates, the NMI watchdog, cronjobs etc.
The measurement of the development phase, which consists of writing the software and testing it, can leverage the same tools as those used in the usage phase. Here we use the resource consumption on a process level and accumulate the resource consumption of all associated processes needed for developing and testing the development phase. The same holds true for the removal and distribution phase, where typically a process is responsible for removing/creating software artefacts on the hard disk, caches etc.
Outlook
For those responsible for software development, this measurability by re-using existing infrastructure layouts allows us to understand and manage the environmental impact of software and how different development and usage approaches affect energy consumption. With the resulting transparency, software developers can thus design their software to be more resource-efficient. For the end users, transparency is created when they can see how much energy their software consumes and compare different products. On the basis of these measurements, one could, for example, build an open platform that makes the data available to everyone and can help consumers make more conscious decisions in terms of climate protection when purchasing software. In addition, this information can help policymakers enact legislation to establish sustainability standards for software. We see the creation of more transparency in ICT as an enormously important element in the future. And this importance is not only related to a development towards more resource efficiency but also to more digital participation and finally rebalancing technological power means for all areas of sustainable digitalisation.
Next page